
Back to Course
Math 6th Grade
-
Ratios, rates, & percentagesIntro to ratios2 Topics|1 Quiz
-
Equivalent ratios4 Topics|5 Quizzes
-
Visualize ratios3 Topics|5 Quizzes
-
Ratio application4 Topics|3 Quizzes
-
Intro to rates5 Topics|3 Quizzes
-
Intro to percents4 Topics|3 Quizzes
-
Percent, decimal, fraction conversions5 Topics|4 Quizzes
-
Percent problems4 Topics|2 Quizzes
-
Percent word problems1 Topic|1 Quiz
-
Arithmetic operationsAdding decimals3 Topics|1 Quiz
-
Subtracting decimals2 Topics|1 Quiz
-
Adding and subtracting decimals word problems2 Topics|1 Quiz
-
Multiplying decimals3 Topics|3 Quizzes
-
Dividing whole numbers2 Topics|2 Quizzes
-
Dividing decimals7 Topics|3 Quizzes
-
Dividing fractions by fractions7 Topics|5 Quizzes
-
Exponents5 Topics|3 Quizzes
-
Order of operations5 Topics|3 Quizzes
-
Negative numbersIntro to negative numbers1 Topic|2 Quizzes
-
Negative decimals & fractions on the number line2 Topics|2 Quizzes
-
Number opposites1 Topic|1 Quiz
-
Comparing negative numbers3 Topics|5 Quizzes
-
Negative symbol as opposite2 Topics|2 Quizzes
-
Absolute value6 Topics|4 Quizzes
-
Coordinate plane6 Topics|4 Quizzes
-
Properties of numbersLeast common multiple3 Topics|1 Quiz
-
Greatest common factor4 Topics|3 Quizzes
-
Variables & expressionsParts of algebraic expressions3 Topics|1 Quiz
-
Substitution & evaluating expressions4 Topics|4 Quizzes
-
Expression value intuition1 Topic|1 Quiz
-
Evaluating expressions word problems3 Topics|1 Quiz
-
Writing algebraic expressions introduction3 Topics|2 Quizzes
-
Writing basic algebraic expressions word problems1 Topic|1 Quiz
-
Distributive property with variables3 Topics|3 Quizzes
-
Combining like terms3 Topics|1 Quiz
-
Equivalent expressions1 Topic|1 Quiz
-
Equations & inequalities introductionAlgebraic equations basics2 Topics|2 Quizzes
-
One-step equations intuition4 Topics|3 Quizzes
-
One-step addition & subtraction equations3 Topics|2 Quizzes
-
One-step multiplication and division equations3 Topics|2 Quizzes
-
Finding mistakes in one-step equations1 Topic|1 Quiz
-
One-step equation word problems1 Topic|3 Quizzes
-
Intro to inequalities with variables4 Topics|5 Quizzes
-
Dependent and independent variables3 Topics|4 Quizzes
-
GeometryAreas of parallelograms2 Topics|2 Quizzes
-
Areas of triangles3 Topics|4 Quizzes
-
Area of composite figures2 Topics|2 Quizzes
-
Geometric solids (3D shapes)2 Topics|2 Quizzes
-
Volume with fractions4 Topics|4 Quizzes
-
Surface area6 Topics|5 Quizzes
-
Polygons on the coordinate plane7 Topics|3 Quizzes
-
Data and statisticsDot plots & frequency tables2 Topics|5 Quizzes
-
Statistical questions1 Topic|1 Quiz
-
Histograms2 Topics|2 Quizzes
-
Mean and median1 Topic|4 Quizzes
-
Mean and median challenge problems4 Topics|2 Quizzes
-
Interquartile range (IQR)1 Topic|1 Quiz
-
Box plots5 Topics|2 Quizzes
-
Mean absolute deviation (MAD)2 Topics
-
Comparing data displays1 Topic|1 Quiz
-
Shape of data distributions2 Topics|1 Quiz
Deprecated: is_quiz_accessable is deprecated since version 3.4.0! Use learndash_is_quiz_accessable instead. in /home/succes48/successtutoring.us/wp-includes/functions.php on line 5213
Time limit: 0
Quiz Summary
0 of 47 Questions completed
Questions:
Information
You have already completed the quiz before. Hence you can not start it again.
Quiz is loading…
You must sign in or sign up to start the quiz.
You must first complete the following:
Results
Quiz complete. Results are being recorded.
Results
0 of 47 Questions answered correctly
Your time:
Time has elapsed
You have reached 0 of 0 point(s), (0)
Earned Point(s): 0 of 0, (0)
0 Essay(s) Pending (Possible Point(s): 0)
Categories
- Not categorized 0%
- 1
- 2
- 3
- 4
- 5
- 6
- 7
- 8
- 9
- 10
- 11
- 12
- 13
- 14
- 15
- 16
- 17
- 18
- 19
- 20
- 21
- 22
- 23
- 24
- 25
- 26
- 27
- 28
- 29
- 30
- 31
- 32
- 33
- 34
- 35
- 36
- 37
- 38
- 39
- 40
- 41
- 42
- 43
- 44
- 45
- 46
- 47
- Current
- Review
- Answered
- Correct
- Incorrect
-
Question 1 of 47
1. Question
The following frequency table shows the essay scores by student in Mr. Ji’s class.

What was the most frequent essay score?
-
points
CorrectIncorrect -
-
Question 2 of 47
2. Question
The following dot plot shows the number of songs on each album in Sal’s collection. Each dot represents a different album.

What is the minimum number of songs on an album?
-
songs
CorrectIncorrect -
-
Question 3 of 47
3. Question
The following frequency table shows the number of hours each employee at Magic Dragon worked yesterday.

How many employees worked fewer than 8 hours yesterday?
-
employees
CorrectIncorrect -
-
Question 4 of 47
4. Question
The following dot plot shows the number of players at each table in Bill’s Bingo Hall. Each dot represents a different table.

What is the lowest number of players at a table?
-
players
CorrectIncorrect -
-
Question 5 of 47
5. Question
The following dot plot shows the number of players at each table in Bill’s Bingo Hall. Each dot represents a different table.

How many tables have fewer than 2 players?
-
tables
CorrectIncorrect -
-
Question 6 of 47
6. Question
The following frequency table shows the number of hours each employee at Magic Dragon worked yesterday.
What was the most frequent number of hours worked yesterday?
-
hours
CorrectIncorrect -
-
Question 7 of 47
7. Question
The following dot plot shows Hank’s lacrosse scoring in each season. Each dot represents a different season.

What was the fewest goals that Hank scored in a season?
-
goals
CorrectIncorrect -
-
Question 8 of 47
8. Question
The following dot plot shows the number of songs on each album in Sal’s collection. Each dot represents a different album.

How many albums have at least 11 songs?
-
albums
CorrectIncorrect -
-
Question 9 of 47
9. Question
The following dot plot shows the mass of each rock in Nija’s rock collection. Each dot represents a different rock.

What is the most frequent mass of a rock?
-
g
CorrectIncorrect -
-
Question 10 of 47
10. Question
The following frequency table shows the number of players on the Russian Bears volleyball team that have been injured each match this year.

How many matches have there been this year?
-
matches
CorrectIncorrect -
-
Question 11 of 47
11. Question
The following dot plot shows the number of cavities for each patient seen by Dr. Hall last week. Each dot represents a different patient.
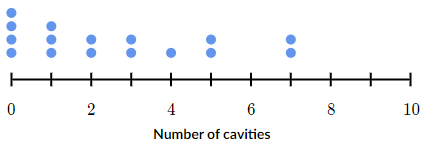
How many patients had more than 5 cavities?
-
patients
CorrectIncorrect -
-
Question 12 of 47
12. Question
The following dot plot shows the number of songs on each album in Sal’s collection. Each dot represents a different album.
How many albums are in Sal’s collection?
-
albums
CorrectIncorrect -
-
Question 13 of 47
13. Question
The following frequency table shows the number of Jui’s pictures that have been published in each of the local magazines.

How many magazines have 2 or more pictures?
-
magazines
CorrectIncorrect -
-
Question 14 of 47
14. Question
The following dot plot shows the number of jokers in each of Marcie’s decks of cards. Each dot represents a different deck of cards.

How many decks of cards does Marcie have?
-
decks
CorrectIncorrect -
-
Question 15 of 47
15. Question
The following dot plot shows the mass of each rock in Nija’s rock collection. Each dot represents a different rock.
What is the mass of the heaviest rock?
-
g
CorrectIncorrect -
-
Question 16 of 47
16. Question
The following dot plot shows the height of each toddler at Ms. Cabrera’s daycare. Each dot represents a different toddler.

What is the most frequent height of a toddler?
-
cm
CorrectIncorrect -
-
Question 17 of 47
17. Question
The following frequency table shows the number of suspensions for each student in Wright Alternative Learning Program.
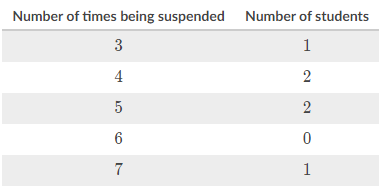
How many students are in the Wright Alternative Learning Program?
-
students
CorrectIncorrect -
-
Question 18 of 47
18. Question
The following dot plot shows the daily high temperature in Kats, Colorado in April. Each dot represents a different day.

What was the greatest high temperature?
-
^o C
CorrectIncorrect -
-
Question 19 of 47
19. Question
The following dot plot shows the number of players at each table in Bill’s Bingo Hall. Each dot represents a different table.
How many tables are in Bill’s Bingo Hall?
-
tables
CorrectIncorrect -
-
Question 20 of 47
20. Question
The following frequency table shows the number of Jui’s pictures that have been published in each of the local magazines.
What is the most frequent number of pictures?
-
pictures
CorrectIncorrect -
-
Question 21 of 47
21. Question
The following dot plot shows the number of jokers in each of Marcie’s decks of cards. Each dot represents a different deck of cards.
How many decks have fewer than 1 joker?
-
decks
CorrectIncorrect -
-
Question 22 of 47
22. Question
The following dot plot shows the number of chocolate chips in each cookie from the package that Shawn has. Each dot represents a different cookie.
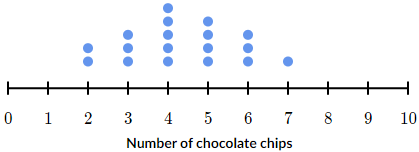
How many cookies were in the package?
-
cookies
CorrectIncorrect -
-
Question 23 of 47
23. Question
The following dot plot shows the mass of each rock in Nija’s rock collection. Each dot represents a different rock.
How many rocks have a mass less than 38 g?
-
rocks
CorrectIncorrect -
-
Question 24 of 47
24. Question
The following frequency table shows the number of fish caught by each of Igor’s family members.
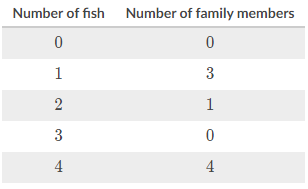
What was the minimum number of fish that a family member caught?
-
fish
CorrectIncorrect -
-
Question 25 of 47
25. Question
The following dot plot shows the height of each toddler at Ms. Cabrera’s daycare. Each dot represents a different toddler.
What is the height of the shortest toddler?
-
cm
CorrectIncorrect -
-
Question 26 of 47
26. Question
The following dot plot shows the essay score for each student in Mr. Ji’s class. Each dot represents a different student.
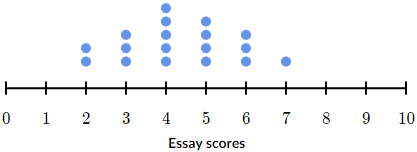
What is the highest essay score?
CorrectIncorrect -
-
Question 27 of 47
27. Question
The following frequency table shows the number of cavities each of Dr. Freese’s patients had.
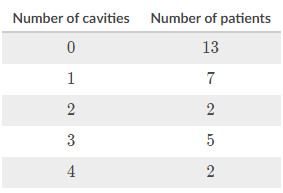
What was the fewest number of cavities that a patient had?
-
cavities
CorrectIncorrect -
-
Question 28 of 47
28. Question
The following dot plot shows the daily high temperature in Kats, Colorado in April. Each dot represents a different day.
What was the minimum high temperature?
-
^o C
CorrectIncorrect -
-
Question 29 of 47
29. Question
The following dot plot shows the mass of each rock in Nija’s rock collection. Each dot represents a different rock.
How many rocks are in Nija’s collection?
-
rocks
CorrectIncorrect -
-
Question 30 of 47
30. Question
The following dot plot shows the number of jokers in each of Marcie’s decks of cards. Each dot represents a different deck of cards.
What is the minimum number of jokers in a deck?
-
jokers
CorrectIncorrect -
-
Question 31 of 47
31. Question
The following frequency table shows the number of A’s each student in Ms. Zast’s class received.

What was the minimum number of A’s that a student received?
-
A’s
CorrectIncorrect -
-
Question 32 of 47
32. Question
The following dot plot shows Hank’s lacrosse scoring in each season. Each dot represents a different season.
What was the maximum number of goals that Hank scored in a season?
-
goals
CorrectIncorrect -
-
Question 33 of 47
33. Question
The following dot plot shows the number of chocolate chips in each cookie from the package that Shawn has. Each dot represents a different cookie.
What is the highest number of chocolate chips in a cookie?
-
chocolate chips
CorrectIncorrect -
-
Question 34 of 47
34. Question
The following frequency table shows the number of strokes it took each golfer to complete Hole 3.

What was the most frequent number of strokes?
-
strokes
CorrectIncorrect -
-
Question 35 of 47
35. Question
The following dot plot shows the number of players at each table in Bill’s Bingo Hall. Each dot represents a different table.
What is the most frequent number of players at a table?
-
players
CorrectIncorrect -
-
Question 36 of 47
36. Question
The following dot plot shows the daily high temperature in Kats, Colorado in April. Each dot represents a different day.
What high temperature occurred most often?
-
^o C
CorrectIncorrect -
-
Question 37 of 47
37. Question
The following frequency table shows the number of cavities each of Dr. Freese’s patients had.
What was the greatest number of cavities that a patient had?
-
cavities
CorrectIncorrect -
-
Question 38 of 47
38. Question
The following dot plot shows the number of cavities for each patient seen by Dr. Hall last week. Each dot represents a different patient.
What was the maximum number of cavities that a patient had?
-
cavities
CorrectIncorrect -
-
Question 39 of 47
39. Question
The following dot plot shows the number of cavities for each patient seen by Dr. Hall last week. Each dot represents a different patient.
What was the most frequent number of cavities that a patient had?
-
cavities
CorrectIncorrect -
-
Question 40 of 47
40. Question
The following dot plot shows the height of each toddler at Ms. Cabrera’s daycare. Each dot represents a different toddler.
How many toddlers are in Ms. Cabrera’s daycare?
-
toddlers
CorrectIncorrect -
-
Question 41 of 47
41. Question
The following frequency table shows the number of goals Hank scored each lacrosse season.

How many seasons of lacrosse did Hank play?
-
seasons
CorrectIncorrect -
-
Question 42 of 47
42. Question
The following dot plot shows Hank’s lacrosse scoring in each season. Each dot represents a different season.
Hank scored fewer than 45 goals in how many seasons?
-
seasons
CorrectIncorrect -
-
Question 43 of 47
43. Question
The following dot plot shows the number of players at each table in Bill’s Bingo Hall. Each dot represents a different table.
What is the highest number of players at a table?
-
players
CorrectIncorrect -
-
Question 44 of 47
44. Question
The following frequency table shows the number of hours of sleep that each of the staff members at Tia’s Toy Store got on Thanksgiving night.
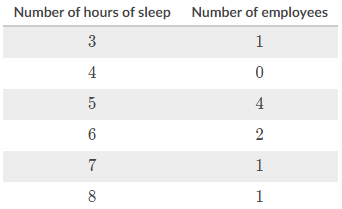
How many employees work at Tia’s Toy Store?
-
employees
CorrectIncorrect -
-
Question 45 of 47
45. Question
The following dot plot shows the number of jokers in each of Marcie’s decks of cards. Each dot represents a different deck of cards.
What is the greatest number of jokers in a deck?
-
jokers
CorrectIncorrect -
-
Question 46 of 47
46. Question
The following dot plot shows the number of jokers in each of Marcie’s decks of cards. Each dot represents a different deck of cards.
What is the most frequent number of jokers in a deck?
-
jokers
CorrectIncorrect -
-
Question 47 of 47
47. Question
The following dot plot shows the number of chocolate chips in each cookie from the package that Shawn has. Each dot represents a different cookie.
What is the most frequent number of chocolate chips in a cookie?
-
chocolate chips
CorrectIncorrect -