
Back to Course
Math 6th Grade
-
Ratios, rates, & percentagesIntro to ratios2 Topics|1 Quiz
-
Equivalent ratios4 Topics|5 Quizzes
-
Visualize ratios3 Topics|5 Quizzes
-
Ratio application4 Topics|3 Quizzes
-
Intro to rates5 Topics|3 Quizzes
-
Intro to percents4 Topics|3 Quizzes
-
Percent, decimal, fraction conversions5 Topics|4 Quizzes
-
Percent problems4 Topics|2 Quizzes
-
Percent word problems1 Topic|1 Quiz
-
Arithmetic operationsAdding decimals3 Topics|1 Quiz
-
Subtracting decimals2 Topics|1 Quiz
-
Adding and subtracting decimals word problems2 Topics|1 Quiz
-
Multiplying decimals3 Topics|3 Quizzes
-
Dividing whole numbers2 Topics|2 Quizzes
-
Dividing decimals7 Topics|3 Quizzes
-
Dividing fractions by fractions7 Topics|5 Quizzes
-
Exponents5 Topics|3 Quizzes
-
Order of operations5 Topics|3 Quizzes
-
Negative numbersIntro to negative numbers1 Topic|2 Quizzes
-
Negative decimals & fractions on the number line2 Topics|2 Quizzes
-
Number opposites1 Topic|1 Quiz
-
Comparing negative numbers3 Topics|5 Quizzes
-
Negative symbol as opposite2 Topics|2 Quizzes
-
Absolute value6 Topics|4 Quizzes
-
Coordinate plane6 Topics|4 Quizzes
-
Properties of numbersLeast common multiple3 Topics|1 Quiz
-
Greatest common factor4 Topics|3 Quizzes
-
Variables & expressionsParts of algebraic expressions3 Topics|1 Quiz
-
Substitution & evaluating expressions4 Topics|4 Quizzes
-
Expression value intuition1 Topic|1 Quiz
-
Evaluating expressions word problems3 Topics|1 Quiz
-
Writing algebraic expressions introduction3 Topics|2 Quizzes
-
Writing basic algebraic expressions word problems1 Topic|1 Quiz
-
Distributive property with variables3 Topics|3 Quizzes
-
Combining like terms3 Topics|1 Quiz
-
Equivalent expressions1 Topic|1 Quiz
-
Equations & inequalities introductionAlgebraic equations basics2 Topics|2 Quizzes
-
One-step equations intuition4 Topics|3 Quizzes
-
One-step addition & subtraction equations3 Topics|2 Quizzes
-
One-step multiplication and division equations3 Topics|2 Quizzes
-
Finding mistakes in one-step equations1 Topic|1 Quiz
-
One-step equation word problems1 Topic|3 Quizzes
-
Intro to inequalities with variables4 Topics|5 Quizzes
-
Dependent and independent variables3 Topics|4 Quizzes
-
GeometryAreas of parallelograms2 Topics|2 Quizzes
-
Areas of triangles3 Topics|4 Quizzes
-
Area of composite figures2 Topics|2 Quizzes
-
Geometric solids (3D shapes)2 Topics|2 Quizzes
-
Volume with fractions4 Topics|4 Quizzes
-
Surface area6 Topics|5 Quizzes
-
Polygons on the coordinate plane7 Topics|3 Quizzes
-
Data and statisticsDot plots & frequency tables2 Topics|5 Quizzes
-
Statistical questions1 Topic|1 Quiz
-
Histograms2 Topics|2 Quizzes
-
Mean and median1 Topic|4 Quizzes
-
Mean and median challenge problems4 Topics|2 Quizzes
-
Interquartile range (IQR)1 Topic|1 Quiz
-
Box plots5 Topics|2 Quizzes
-
Mean absolute deviation (MAD)2 Topics
-
Comparing data displays1 Topic|1 Quiz
-
Shape of data distributions2 Topics|1 Quiz
Deprecated: is_quiz_accessable is deprecated since version 3.4.0! Use learndash_is_quiz_accessable instead. in /home/succes48/successtutoring.us/wp-includes/functions.php on line 5213
Time limit: 0
Quiz Summary
0 of 12 Questions completed
Questions:
Information
You have already completed the quiz before. Hence you can not start it again.
Quiz is loading…
You must sign in or sign up to start the quiz.
You must first complete the following:
Results
Quiz complete. Results are being recorded.
Results
0 of 12 Questions answered correctly
Your time:
Time has elapsed
You have reached 0 of 0 point(s), (0)
Earned Point(s): 0 of 0, (0)
0 Essay(s) Pending (Possible Point(s): 0)
Categories
- Not categorized 0%
- 1
- 2
- 3
- 4
- 5
- 6
- 7
- 8
- 9
- 10
- 11
- 12
- Current
- Review
- Answered
- Correct
- Incorrect
-
Question 1 of 12
1. Question
Isabella grows several varieties of pepper plants. The following dot plots show the numbers of peppers, rounded to the nearest 5, per plant for different varieties. Each dot represents a different plant.
Order the varieties from least to greatest typical number of peppers per plant.
Put the graph with the least typical value on top.
View Answers:
CorrectIncorrect -
-
Question 2 of 12
2. Question
Ms. Munoz had students in three class periods write essays for a diagnostic test. The following dot plots shows the scores from each class. Each dot represents a different student’s score.
Order the class periods from least to greatest typical score.Put the graph with the least typical value on top.
View Answers:
CorrectIncorrect -
-
Question 3 of 12
3. Question
The following dot plot shows the number of books each student checked out from the library last month. Each dot represents a different student.

Which of the following is a typical number of books one student checked out?
Choose 1 answer:
CorrectIncorrect -
Question 4 of 12
4. Question
The following dot plot shows the mass, in kilograms, of each of the 46 kittens adopted from an animal shelter last month. Each dot represents a different kitten.

Which of the following is a typical mass of one kitten?
Choose 1 answer:CorrectIncorrect -
Question 5 of 12
5. Question
The following dot plots shows the number of hours of sleep employees got before a major sale at three stores. Each dot represents a different employee.
Order the stores from least to greatest typical number of hours of sleep per employee.Put the graph with the least typical value on top.
View Answers:
CorrectIncorrect -
-
Question 6 of 12
6. Question
The following dot plot shows the number of cavities each of Dr. Vance’s 63 patients had last month. Each dot represents a different patient.
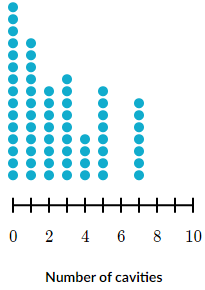
Which of the following is a typical number of cavities one patient had?
Choose 1 answer:CorrectIncorrect -
Question 7 of 12
7. Question
The following dot plots shows the number of strokes golf players required at each hole. Each dot represents a different player.
Order the holes from least to greatest typical number of strokes per player.Put the graph with the least typical value on top.
View Answers:
CorrectIncorrect -
-
Question 8 of 12
8. Question
The following dot plot shows the number of chocolate chips in each cookie that Shawn has. Each dot represents a different cookie.

Which of the following is a typical amount of chocolate chips in one of Shawn’s cookies?
Choose 1 answer:CorrectIncorrect -
Question 9 of 12
9. Question
The following dot plots show the numbers of people per table at Kingsley’s Bingo Hall on three different nights. Each dot represents one of the 20 tables.
Order the nights from least to greatest typical number of people per table.View Answers:
CorrectIncorrect -
-
Question 10 of 12
10. Question
The following dot plots shows the number of players injured per game for three different teams. Each dot represents a different game.
Order the teams from least to greatest typical number of injuries per game.Put the graph with the least typical value on top
View Answers:
CorrectIncorrect -
-
Question 11 of 12
11. Question
The following dot plot shows the number of weekly challenge questions each of the 30 members the Math Bowl team answered correctly last season. Each dot represents a different member.

Number of correct challenge questions
Which of the following is a typical number of challenge questions one member answered correctly?
Choose 1answer:CorrectIncorrect -
Question 12 of 12
12. Question
The following dot plot shows the number of wildcards in each of Sampson’s decks of cards. Each dot represents a different deck.

Number of wildcards
Which of the following is a typical number of wildcards in one of Sampson’s decks?
Choose 1 answer:CorrectIncorrect


