
Back to Course
Math 6th Grade
-
Ratios, rates, & percentagesIntro to ratios2 Topics|1 Quiz
-
Equivalent ratios4 Topics|5 Quizzes
-
Visualize ratios3 Topics|5 Quizzes
-
Ratio application4 Topics|3 Quizzes
-
Intro to rates5 Topics|3 Quizzes
-
Intro to percents4 Topics|3 Quizzes
-
Percent, decimal, fraction conversions5 Topics|4 Quizzes
-
Percent problems4 Topics|2 Quizzes
-
Percent word problems1 Topic|1 Quiz
-
Arithmetic operationsAdding decimals3 Topics|1 Quiz
-
Subtracting decimals2 Topics|1 Quiz
-
Adding and subtracting decimals word problems2 Topics|1 Quiz
-
Multiplying decimals3 Topics|3 Quizzes
-
Dividing whole numbers2 Topics|2 Quizzes
-
Dividing decimals7 Topics|3 Quizzes
-
Dividing fractions by fractions7 Topics|5 Quizzes
-
Exponents5 Topics|3 Quizzes
-
Order of operations5 Topics|3 Quizzes
-
Negative numbersIntro to negative numbers1 Topic|2 Quizzes
-
Negative decimals & fractions on the number line2 Topics|2 Quizzes
-
Number opposites1 Topic|1 Quiz
-
Comparing negative numbers3 Topics|5 Quizzes
-
Negative symbol as opposite2 Topics|2 Quizzes
-
Absolute value6 Topics|4 Quizzes
-
Coordinate plane6 Topics|4 Quizzes
-
Properties of numbersLeast common multiple3 Topics|1 Quiz
-
Greatest common factor4 Topics|3 Quizzes
-
Variables & expressionsParts of algebraic expressions3 Topics|1 Quiz
-
Substitution & evaluating expressions4 Topics|4 Quizzes
-
Expression value intuition1 Topic|1 Quiz
-
Evaluating expressions word problems3 Topics|1 Quiz
-
Writing algebraic expressions introduction3 Topics|2 Quizzes
-
Writing basic algebraic expressions word problems1 Topic|1 Quiz
-
Distributive property with variables3 Topics|3 Quizzes
-
Combining like terms3 Topics|1 Quiz
-
Equivalent expressions1 Topic|1 Quiz
-
Equations & inequalities introductionAlgebraic equations basics2 Topics|2 Quizzes
-
One-step equations intuition4 Topics|3 Quizzes
-
One-step addition & subtraction equations3 Topics|2 Quizzes
-
One-step multiplication and division equations3 Topics|2 Quizzes
-
Finding mistakes in one-step equations1 Topic|1 Quiz
-
One-step equation word problems1 Topic|3 Quizzes
-
Intro to inequalities with variables4 Topics|5 Quizzes
-
Dependent and independent variables3 Topics|4 Quizzes
-
GeometryAreas of parallelograms2 Topics|2 Quizzes
-
Areas of triangles3 Topics|4 Quizzes
-
Area of composite figures2 Topics|2 Quizzes
-
Geometric solids (3D shapes)2 Topics|2 Quizzes
-
Volume with fractions4 Topics|4 Quizzes
-
Surface area6 Topics|5 Quizzes
-
Polygons on the coordinate plane7 Topics|3 Quizzes
-
Data and statisticsDot plots & frequency tables2 Topics|5 Quizzes
-
Statistical questions1 Topic|1 Quiz
-
Histograms2 Topics|2 Quizzes
-
Mean and median1 Topic|4 Quizzes
-
Mean and median challenge problems4 Topics|2 Quizzes
-
Interquartile range (IQR)1 Topic|1 Quiz
-
Box plots5 Topics|2 Quizzes
-
Mean absolute deviation (MAD)2 Topics
-
Comparing data displays1 Topic|1 Quiz
-
Shape of data distributions2 Topics|1 Quiz
Deprecated: is_quiz_accessable is deprecated since version 3.4.0! Use learndash_is_quiz_accessable instead. in /home/succes48/successtutoring.us/wp-includes/functions.php on line 5213
Time limit: 0
Quiz Summary
0 of 20 Questions completed
Questions:
Information
You have already completed the quiz before. Hence you can not start it again.
Quiz is loading…
You must sign in or sign up to start the quiz.
You must first complete the following:
Results
Quiz complete. Results are being recorded.
Results
0 of 20 Questions answered correctly
Your time:
Time has elapsed
You have reached 0 of 0 point(s), (0)
Earned Point(s): 0 of 0, (0)
0 Essay(s) Pending (Possible Point(s): 0)
Categories
- Not categorized 0%
- 1
- 2
- 3
- 4
- 5
- 6
- 7
- 8
- 9
- 10
- 11
- 12
- 13
- 14
- 15
- 16
- 17
- 18
- 19
- 20
- Current
- Review
- Answered
- Correct
- Incorrect
-
Question 1 of 20
1. Question
The following data points represent how many push-ups Curt did each night last week.
25, 23, 24, 25, 25, 25, 25
Using this data, create a frequency table.-
Number of push-ups Number of nights
23
24
25
-
-
Question 2 of 20
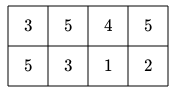
2. Question
The data below shows the number of hours of sleep that each of the eight staff members at Eroy’s Electronics got on Thanksgiving night.
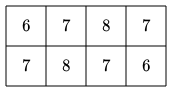
Using this data, create a frequency table.
-
Number of hours of sleep Number of employees
6
7
8
-
-
Question 3 of 20
3. Question
The following data points represent the number of players on the Russian Bears volleyball team that were injured in each match this year.
1, 2, 2, 1, 2, 1
Using this data, create a frequency table.-
Number of injured players Number of matches
0
1
2
-
-
Question 4 of 20
4. Question
The data below shows how old each of Brad’s eight kids were when they started kindergarten.
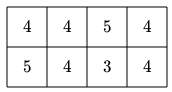
Using this data, create a frequency table.
-
Age (in years) Number of kids
3
4
5
-
-
Question 5 of 20
5. Question
The following data points represent the number of jars of honey Martha the Bear consumed each day this week.
4, 4, 5, 2, 2, 3, 4
Using this data, create a frequency table.-
Number of jars of honey Number of days
2
3
4
5
-
-
Question 6 of 20
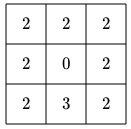
6. Question
The data below shows the number of times that each of the eight students in the Wright Alternative Learning Program has been suspended from school.
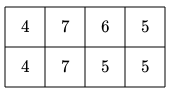
Using this data, create a frequency table.
-
Number of times being suspended Number of students
4
5
6
7
-
-
Question 7 of 20
7. Question
The following data points represent the number of holes that moths ate in each of Grandma Marion’s dresses.
7, 8, 8, 5, 7, 8
Using this data, create a frequency table.-
Number of holes Number of dresses
5
6
7
8
-
-
Question 8 of 20
8. Question
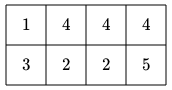
The data below shows the number of hermit crabs that live in each of the nine terrariums that Sunipa owns.
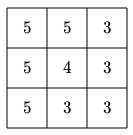
Using this data, create a frequency table.
-
Number of hermit crabs Number of terrariums
3
4
5
-
-
Question 9 of 20
9. Question
The following data points represent the number of trick-or-treaters James had each year since he started putting pumpkins in his yard.
54, 56, 53, 54, 56, 55
Using this data, complete the frequency table.-
Number of trick-or-treaters Number of years
52
53
54
55
56
-
-
Question 10 of 20
10. Question
The data below shows the number of children that each of the eight members of Moms’ Club has.
Using this data, create a frequency table.
-
Number of children Number of members
1
2
3
4
5
-
-
Question 11 of 20
11. Question
The following data points represent how many goals Hank scored each season.
45, 43, 45, 44, 44, 44, 47
Using this data, create a frequency table.-
Number of goals Number of seasons
43
44
45
46
47
-
-
Question 12 of 20
12. Question
The data below shows the number of windows in each of the nine rooms at Alexa’s house.
Using this data, create a frequency table.
-
Number of windows Number of rooms
0
1
2
3
-
-
Question 13 of 20
13. Question
The following data points represent how many golf tournaments Herth won each season.
1, 0, 4, 2, 2, 0, 1
Using this data, create a frequency table.-
Number of tournaments Number of seasons
0
1
2
3
4
-
-
Question 14 of 20
14. Question
The data below shows the number of bags that each of the eight exchange students from Bridgewater University packed.
Using this data, create a frequency table.
-
Number of bags Number of exchange students
1
2
3
4
5
-
-
Question 15 of 20
15. Question
The following data points represent how many fish Hugo caught in each tournament.
27, 27, 28, 28, 25, 26, 27
Using this data, create a frequency table.-
Number of fish Number of tournaments
25
26
27
28
-
-
Question 16 of 20
16. Question
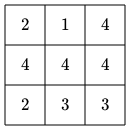
Tank is a car salesman at EH Auto Dealer. The data below shows how many cars he sold in each of the last nine months.
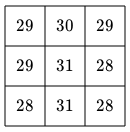
Using this data, create a frequency table.
-
Number of cars sold Number of months
28
29
30
31
-
-
Question 17 of 20
17. Question
The following data points represent the number of pictures that Kai has had published in each of the local newspapers.
4, 3, 0, 3, 1, 0
Using this data, create a frequency table.-
Number of pictures Number of newspapers
0
1
2
3
4
-
-
Question 18 of 20
18. Question
The data below shows the number of wheels that are on each of the nine vehicles in Bora’s Auto Service Shop.
Using this data, create a frequency table.
-
Number of wheels Number of vehicles
1
2
3
4
-
-
Question 19 of 20
19. Question
The following data points represent the number of parking spots at each of the houses on Lombardi Avenue.
2, 1, 2, 0, 2, 4, 3
Using this data, create a frequency table.-
Number of parking spots Number of houses
0
1
2
3
4
-
-
Question 20 of 20
20. Question
Kama cleans dishes at Keith’s Kettle. The data below shows the number of dishes she cleaned in each of her nine shifts over the last two weeks.
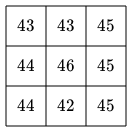
Using this data, create a frequency table.
-
Number of dishes Number of shifts
42
43
44
45
46
-