
Back to Course
Math 8th grade
-
Repeating decimals3 Topics|3 Quizzes
-
Square roots & cube roots5 Topics|6 Quizzes
-
Irrational numbers3 Topics|2 Quizzes
-
Approximating irrational numbers4 Topics|3 Quizzes
-
Exponents with negative bases6 Topics|3 Quizzes
-
Exponent properties intro3 Topics|4 Quizzes
-
Negative exponents2 Topics|1 Quiz
-
Exponent properties (integer exponents)2 Topics|2 Quizzes
-
Working with powers of 102 Topics|2 Quizzes
-
Scientific notation intro2 Topics|1 Quiz
-
Arithmetic with numbers in scientific notation4 Topics|2 Quizzes
-
Scientific notation word problems3 Topics|1 Quiz
-
Equations with variables on both sides4 Topics|2 Quizzes
-
Equations with parentheses1 Topic|2 Quizzes
-
Number of solutions to equations4 Topics|2 Quizzes
-
Equations word problems2 Topics|1 Quiz
-
Graphing proportional relationships2 Topics|1 Quiz
-
Solutions to linear equations4 Topics|2 Quizzes
-
Intercepts5 Topics|2 Quizzes
-
Slope8 Topics|3 Quizzes
-
Intro to slope-intercept form2 Topics|1 Quiz
-
Writing slope-intercept equations5 Topics|2 Quizzes
-
Functions7 Topics|3 Quizzes
-
Linear models7 Topics|3 Quizzes
-
Comparing linear functions6 Topics|1 Quiz
-
Constructing linear models for real-world relationships5 Topics|1 Quiz
-
Recognizing functions9 Topics|2 Quizzes
-
Testing if a relationship is a function
-
Relations and functions
-
Recognizing functions from graph
-
Checking if a table represents a function
-
Recognizing functions from table
-
Checking if an equation represents a function
-
Does a vertical line represent a function?
-
Recognizing functions from verbal description
-
Recognizing functions from verbal description word problem
-
Testing if a relationship is a function
-
Linear and nonlinear functions5 Topics|2 Quizzes
-
Intro to systems of equations3 Topics|1 Quiz
-
Solving systems with substitution6 Topics|1 Quiz
-
Systems of equations with substitution: 2y=x+7 & x=y-4
-
Systems of equations with substitution: y=4x-17.5 & y+2x=6.5
-
Systems of equations with substitution: -3x-4y=-2 & y=2x-5
-
Systems of equations with substitution: 9x+3y=15 & y-x=5
-
Systems of equations with substitution: y=-5x+8 & 10x+2y=-2
-
Systems of equations with substitution: y=-1/4x+100 & y=-1/4x+120
-
Systems of equations with substitution: 2y=x+7 & x=y-4
-
Number of solutions to systems of equations5 Topics|1 Quiz
-
Systems of equations number of solutions: fruit prices (1 of 2)
-
Solutions to systems of equations: dependent vs. independent
-
Number of solutions to a system of equations
-
Number of solutions to a system of equations algebraically
-
How many solutions does a system of linear equations have if there are at least two?
-
Systems of equations number of solutions: fruit prices (1 of 2)
-
Systems of equations word problems7 Topics|2 Quizzes
-
Angles between intersecting lines4 Topics|3 Quizzes
-
Triangle angles7 Topics|3 Quizzes
-
Pythagorean theorem3 Topics|4 Quizzes
-
Pythagorean theorem application4 Topics|5 Quizzes
-
Pythagorean theorem and distance between points1 Topic|1 Quiz
-
Pythagorean theorem proofs4 Topics
-
Volume3 Topics|4 Quizzes
-
Transformations intro3 Topics|1 Quiz
-
Translations3 Topics|1 Quiz
-
Rotations2 Topics|2 Quizzes
-
Reflections3 Topics|1 Quiz
-
Properties & definitions of transformations3 Topics|3 Quizzes
-
Dilations5 Topics|2 Quizzes
-
Congruence and similarity4 Topics|2 Quizzes
-
Introduction to scatter plots1 Topic|1 Quiz
-
Interpreting scatter plots2 Topics|2 Quizzes
-
Estimating lines of best fit4 Topics|3 Quizzes
-
Two-way tables3 Topics|4 Quizzes
Deprecated: is_quiz_accessable is deprecated since version 3.4.0! Use learndash_is_quiz_accessable instead. in /home/succes48/successtutoring.us/wp-includes/functions.php on line 5213
Time limit: 0
Quiz Summary
0 of 10 Questions completed
Questions:
Information
You have already completed the quiz before. Hence you can not start it again.
Quiz is loading…
You must sign in or sign up to start the quiz.
You must first complete the following:
Results
Quiz complete. Results are being recorded.
Results
0 of 10 Questions answered correctly
Your time:
Time has elapsed
You have reached 0 of 0 point(s), (0)
Earned Point(s): 0 of 0, (0)
0 Essay(s) Pending (Possible Point(s): 0)
Categories
- Not categorized 0%
- 1
- 2
- 3
- 4
- 5
- 6
- 7
- 8
- 9
- 10
- Current
- Review
- Answered
- Correct
- Incorrect
-
Question 1 of 10
1. Question
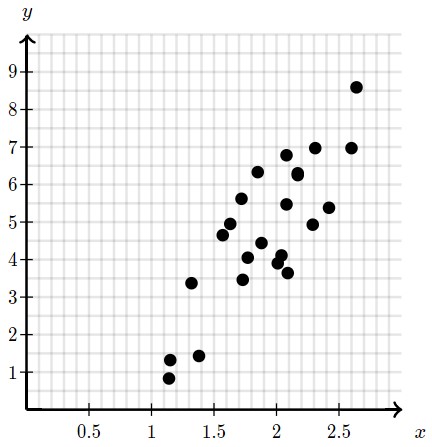
What is the best description of the relationship in the scatterplot below?

Choose 1 answer:
CorrectIncorrect -
Question 2 of 10
2. Question
An international cake competition attracted 50 bakers from around the world. The graph below shows the relationship between the amount of sugar in the cakes (in grams per 100 grams of cake) and the scores the cakes received.
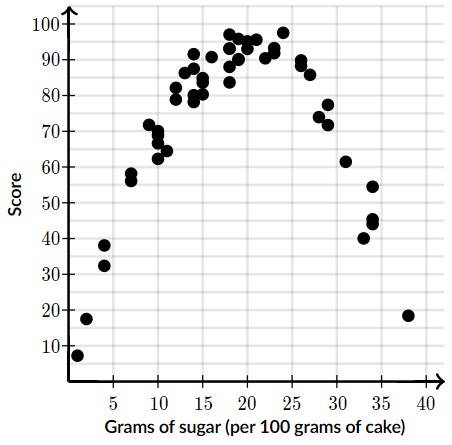
What is the best description of this relationship?
Choose 1 answer:
CorrectIncorrect -
Question 3 of 10
3. Question
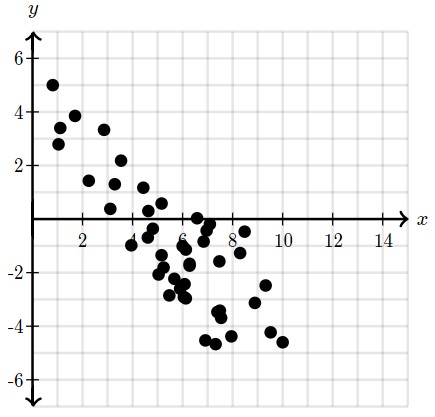
What is the best description of the relationship in the scatterplot below?
Choose 1 answer:
CorrectIncorrect -
Question 4 of 10
4. Question
The plot shown below describes the relationship between the average income in a city and the average rent for a 1-bedroom apartment in that city.
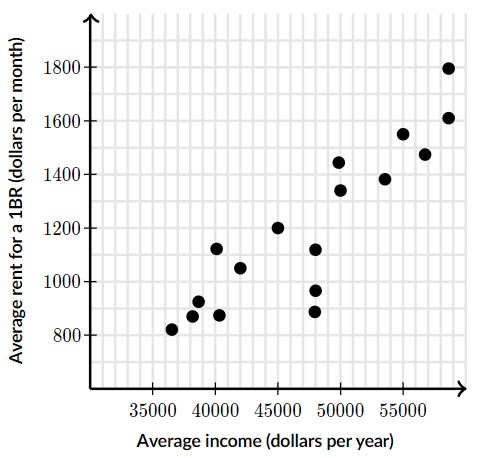
What is the best description of this relationship?
Choose 1 answer:
CorrectIncorrect -
Question 5 of 10
5. Question
What is the best description of the relationship in the scatterplot below?

Choose 1 answer:
CorrectIncorrect -
Question 6 of 10
6. Question
Aubree wanted to see if there is a connection between the time a given exam takes place and the average score of this exam. She collected data about all the exams from the previous year and arranged the average scores of the exams according to the period they took place, as shown below.

What is the best description of this relationship?
Choose 1 answer:
CorrectIncorrect -
Question 7 of 10
7. Question
What is the best description of the relationship in the scatterplot below?
Choose 1 answer:
CorrectIncorrect -
Question 8 of 10
8. Question
The graph below shows the relationship between population density and pollution per person for 36 Japanese cities.
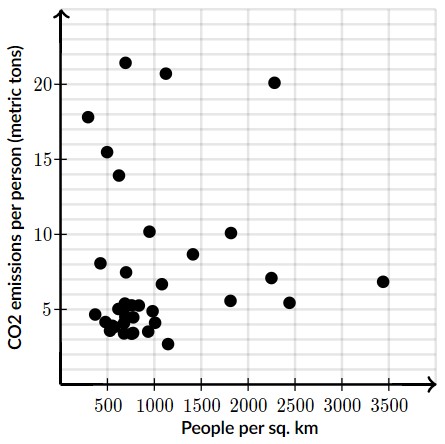
What is the best description of this relationship?
Choose 1 answer:
CorrectIncorrect -
Question 9 of 10
9. Question
The graph shown below shows the relationship between the age of drivers and the number of car accidents per 100 drivers in the year 2009.
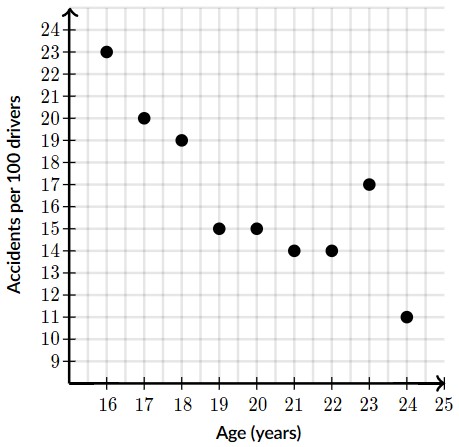
What is the best description of this relationship?
Choose 1 answer:
CorrectIncorrect -
Question 10 of 10
10. Question
What is the best description of the relationship in the scatterplot below?
Choose 1 answer:
CorrectIncorrect