
Back to Course
Math 8th grade
-
Repeating decimals3 Topics|3 Quizzes
-
Square roots & cube roots5 Topics|6 Quizzes
-
Irrational numbers3 Topics|2 Quizzes
-
Approximating irrational numbers4 Topics|3 Quizzes
-
Exponents with negative bases6 Topics|3 Quizzes
-
Exponent properties intro3 Topics|4 Quizzes
-
Negative exponents2 Topics|1 Quiz
-
Exponent properties (integer exponents)2 Topics|2 Quizzes
-
Working with powers of 102 Topics|2 Quizzes
-
Scientific notation intro2 Topics|1 Quiz
-
Arithmetic with numbers in scientific notation4 Topics|2 Quizzes
-
Scientific notation word problems3 Topics|1 Quiz
-
Equations with variables on both sides4 Topics|2 Quizzes
-
Equations with parentheses1 Topic|2 Quizzes
-
Number of solutions to equations4 Topics|2 Quizzes
-
Equations word problems2 Topics|1 Quiz
-
Graphing proportional relationships2 Topics|1 Quiz
-
Solutions to linear equations4 Topics|2 Quizzes
-
Intercepts5 Topics|2 Quizzes
-
Slope8 Topics|3 Quizzes
-
Intro to slope-intercept form2 Topics|1 Quiz
-
Writing slope-intercept equations5 Topics|2 Quizzes
-
Functions7 Topics|3 Quizzes
-
Linear models7 Topics|3 Quizzes
-
Comparing linear functions6 Topics|1 Quiz
-
Constructing linear models for real-world relationships5 Topics|1 Quiz
-
Recognizing functions9 Topics|2 Quizzes
-
Testing if a relationship is a function
-
Relations and functions
-
Recognizing functions from graph
-
Checking if a table represents a function
-
Recognizing functions from table
-
Checking if an equation represents a function
-
Does a vertical line represent a function?
-
Recognizing functions from verbal description
-
Recognizing functions from verbal description word problem
-
Testing if a relationship is a function
-
Linear and nonlinear functions5 Topics|2 Quizzes
-
Intro to systems of equations3 Topics|1 Quiz
-
Solving systems with substitution6 Topics|1 Quiz
-
Systems of equations with substitution: 2y=x+7 & x=y-4
-
Systems of equations with substitution: y=4x-17.5 & y+2x=6.5
-
Systems of equations with substitution: -3x-4y=-2 & y=2x-5
-
Systems of equations with substitution: 9x+3y=15 & y-x=5
-
Systems of equations with substitution: y=-5x+8 & 10x+2y=-2
-
Systems of equations with substitution: y=-1/4x+100 & y=-1/4x+120
-
Systems of equations with substitution: 2y=x+7 & x=y-4
-
Number of solutions to systems of equations5 Topics|1 Quiz
-
Systems of equations number of solutions: fruit prices (1 of 2)
-
Solutions to systems of equations: dependent vs. independent
-
Number of solutions to a system of equations
-
Number of solutions to a system of equations algebraically
-
How many solutions does a system of linear equations have if there are at least two?
-
Systems of equations number of solutions: fruit prices (1 of 2)
-
Systems of equations word problems7 Topics|2 Quizzes
-
Angles between intersecting lines4 Topics|3 Quizzes
-
Triangle angles7 Topics|3 Quizzes
-
Pythagorean theorem3 Topics|4 Quizzes
-
Pythagorean theorem application4 Topics|5 Quizzes
-
Pythagorean theorem and distance between points1 Topic|1 Quiz
-
Pythagorean theorem proofs4 Topics
-
Volume3 Topics|4 Quizzes
-
Transformations intro3 Topics|1 Quiz
-
Translations3 Topics|1 Quiz
-
Rotations2 Topics|2 Quizzes
-
Reflections3 Topics|1 Quiz
-
Properties & definitions of transformations3 Topics|3 Quizzes
-
Dilations5 Topics|2 Quizzes
-
Congruence and similarity4 Topics|2 Quizzes
-
Introduction to scatter plots1 Topic|1 Quiz
-
Interpreting scatter plots2 Topics|2 Quizzes
-
Estimating lines of best fit4 Topics|3 Quizzes
-
Two-way tables3 Topics|4 Quizzes
Deprecated: is_quiz_accessable is deprecated since version 3.4.0! Use learndash_is_quiz_accessable instead. in /home/succes48/successtutoring.us/wp-includes/functions.php on line 5213
Time limit: 0
Quiz Summary
0 of 10 Questions completed
Questions:
Information
You have already completed the quiz before. Hence you can not start it again.
Quiz is loading…
You must sign in or sign up to start the quiz.
You must first complete the following:
Results
Quiz complete. Results are being recorded.
Results
0 of 10 Questions answered correctly
Your time:
Time has elapsed
You have reached 0 of 0 point(s), (0)
Earned Point(s): 0 of 0, (0)
0 Essay(s) Pending (Possible Point(s): 0)
Categories
- Not categorized 0%
- 1
- 2
- 3
- 4
- 5
- 6
- 7
- 8
- 9
- 10
- Current
- Review
- Answered
- Correct
- Incorrect
-
Question 1 of 10
1. Question
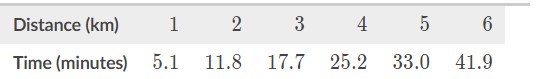
Corey wants to predict how much time a run will take based on the distance of the run. He collected some data on the time (in minutes) and distance (in kilometers) of some of his previous runs. His data is summarized in the table below.
All of the scatter plots below display the data correctly, but which one of them displays the data best?
By convention, a good scatter plot uses a reasonable scale on both axes and puts the explanatory variable on the x-axis.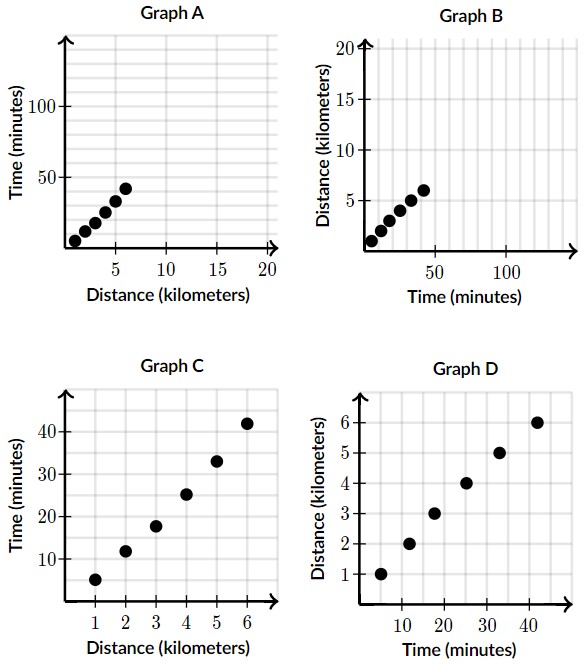 CorrectIncorrect
 -
Question 2 of 10
2. Question
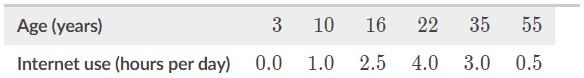
Nate wants to predict how long people use the internet each day based on their age. The table below shows the age (in years) and average daily internet usage (in hours) for a sample of people.
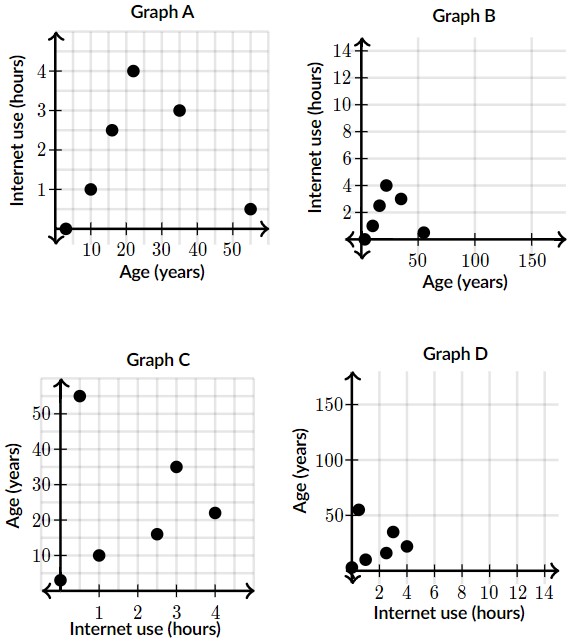
All of the scatter plots below display the data correctly, but which one of them displays the data best?
By convention, a good scatter plot uses a reasonable scale on both axes and puts the explanatory variable on the x-axis.Choose 1 answer:
 CorrectIncorrect
 -
Question 3 of 10
3. Question
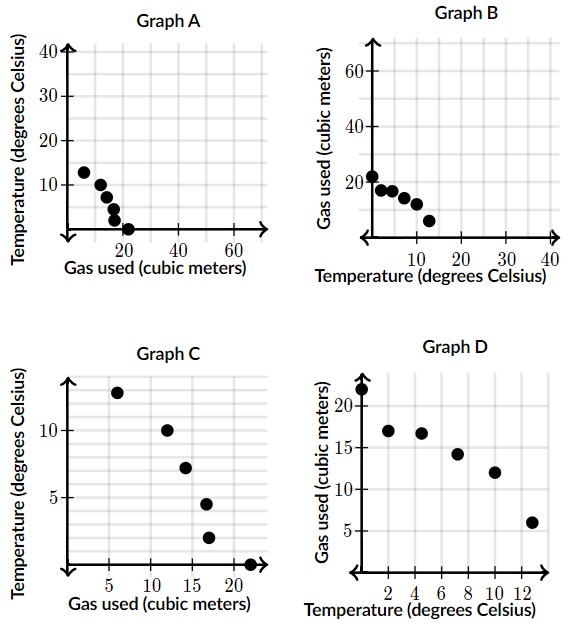
Cindy wants to predict how much energy she will use to heat her home based on how cold it is outside. The table below shows the mean amount of gas per day (in cubic meters) that Cindy used each month and the average temperature that month (in degrees Celsius) for one heating season.
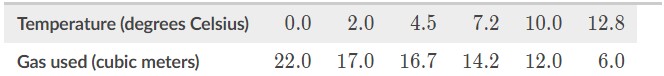
All of the scatter plots below display the data correctly, but which one of them displays the data best?
By convention, a good scatter plot uses a reasonable scale on both axes and puts the explanatory variable on the x-axis.Choose 1 answer:
 CorrectIncorrect
 -
Question 4 of 10
4. Question
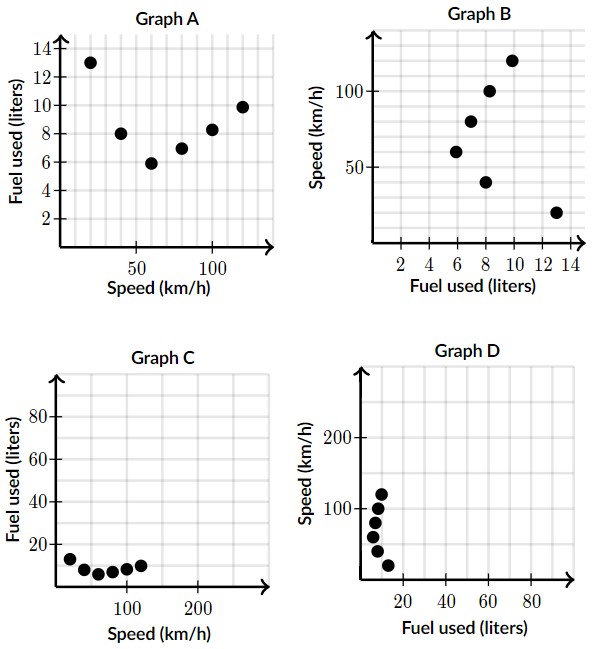
Lynn wants to predict how much fuel her car will use based on its speed. She drove her car 100 km at each of the speeds below, and she measured how much fuel was used at each speed. Her data is summarized in the table below.
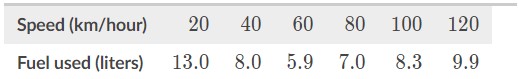
All of the scatter plots below display the data correctly, but which one of them displays the data best?
By convention, a good scatter plot uses a reasonable scale on both axes and puts the explanatory variable on the x-axis.Choose 1 answer:
 CorrectIncorrect
 -
Question 5 of 10
5. Question
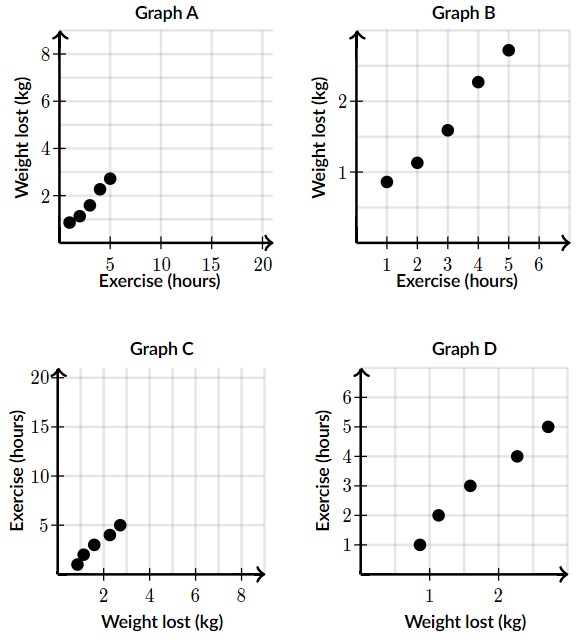
Arthur wanted to investigate how the amount he exercises impacts his weight loss. Each week he recorded the number of hours he exercised and the amount of weight he lost that week (in kilograms).
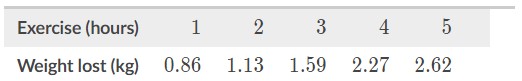
All of the scatter plots below display the data correctly, but which one of them displays the data best?
By convention, a good scatter plot uses a reasonable scale on both axes and puts the explanatory variable on the x-axis.Choose 1 answer:
 CorrectIncorrect
 -
Question 6 of 10
6. Question
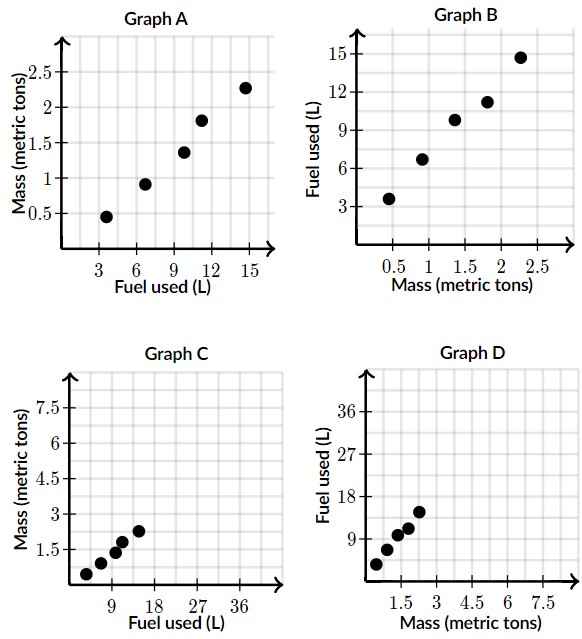
A car company wants to predict how much fuel different cars will use based on their masses. They took a sample of cars, drove each car 100 km, and measured how much fuel was used in each case (in liters). The data is summarized in the table below.
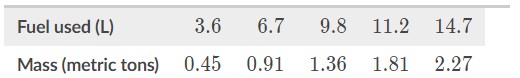
All of the scatter plots below display the data correctly, but which one of them displays the data best?
By convention, a good scatter plot uses a reasonable scale on both axes and puts the explanatory variable on the x-axis.Choose 1 answer:
 CorrectIncorrect
 -
Question 7 of 10
7. Question
Daniel wants to predict how much time a hike will take based on the distance of the hike. He collected some data on the time (in hours) and distance (in kilometers) of some of his previous hikes. His data is summarized in the following table:
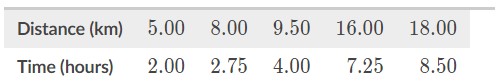
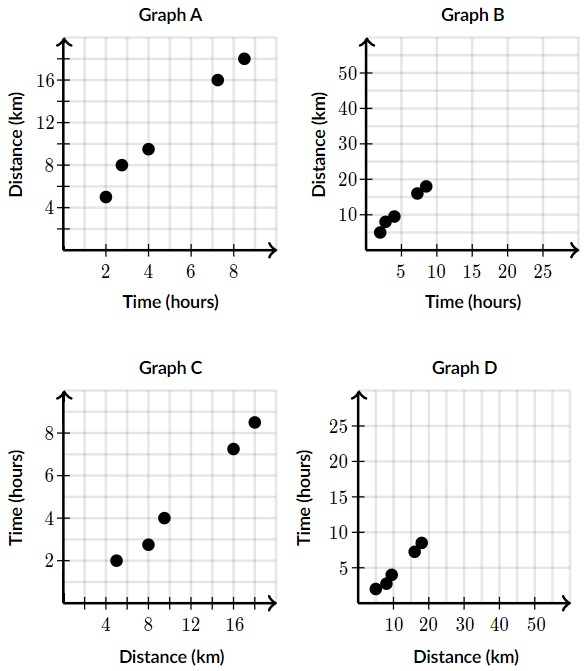
All of the scatter plots below display the data correctly, but which one of them displays the data best?
By convention, a good scatter plot uses a reasonable scale on both axes and puts the explanatory variable on the x-axis.Choose 1 answer:
 CorrectIncorrect
 -
Question 8 of 10
8. Question
Carley owns an ice cream stand. She wants to predict how many ice cream cones she will sell as a function of the average daily high temperature each month. The data for the past 7 months is shown in the table below.
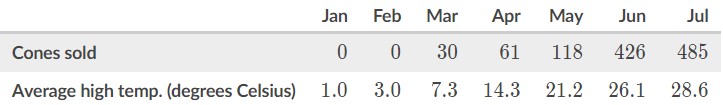
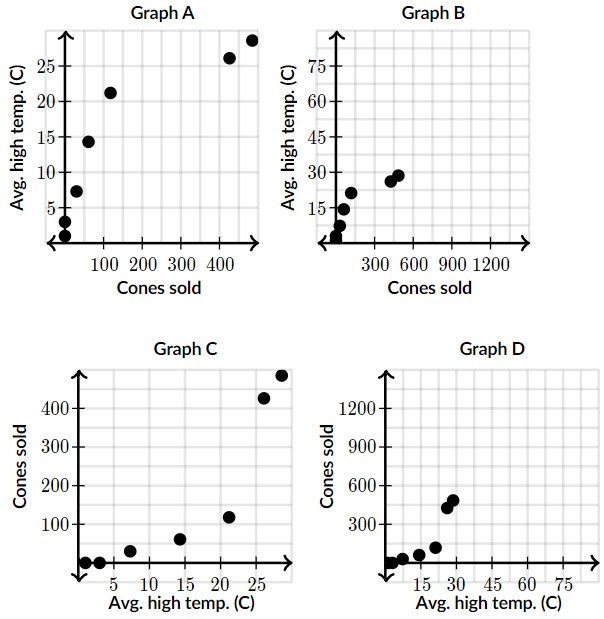
All of the scatter plots below display the data correctly, but which one of them displays the data best?
By convention, a good scatter plot uses a reasonable scale on both axes and puts the explanatory variable on the x-axis.Choose 1 answer:
 CorrectIncorrect
 -
Question 9 of 10
9. Question
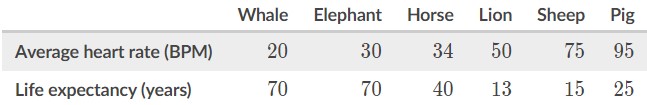
A group of scientists wants to investigate if they can predict the life expectancy of mammal species given its average heart rate. The table below shows the relationship between average heart rate (in beats per minute) and life expectancy (in years) for a sample of mammals.
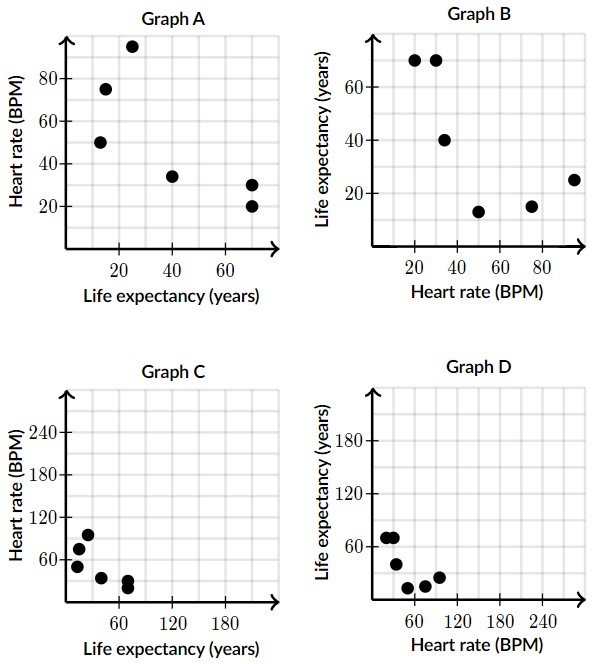
All of the scatter plots below display the data correctly, but which one of them displays the data best?
By convention, a good scatter plot uses a reasonable scale on both axes and puts the explanatory variable on the x-axis.Choose 1 answer:
 CorrectIncorrect
 -
Question 10 of 10
10. Question
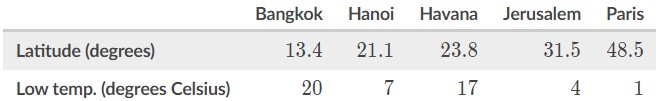
A group of meteorologists wanted to investigate if average low temperature is a function of latitude. They collected data in the table below.
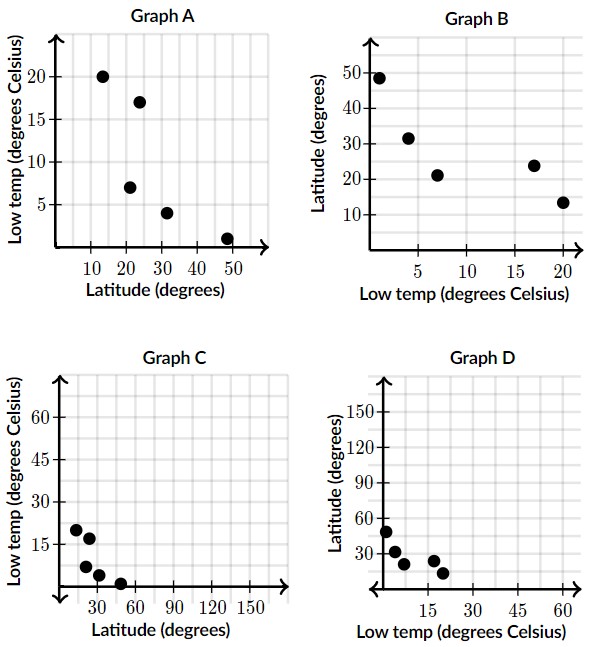
All of the scatter plots below display the data correctly, but which one of them displays the data best?
By convention, a good scatter plot uses a reasonable scale on both axes and puts the explanatory variable on the x-axis.Choose 1 answer:
 CorrectIncorrect